Kimchi now has native debugger support
Real breakpoints, real stack traces, live variable inspection. No more print statements. Kimchi speaks the Debug Adapter Protocol natively, so the agent observes runtime state instead of guessing at it.
Kimchi now has native debugger support. Real breakpoints, real stack traces, live variable inspection, and perhaps more importantly, no more print statements.
Your AI coding agent steps through code the same way you do in your IDE, because it's using the same protocol under the hood.
Debugging is the thing AI coding agents have always done badly. They print, run, read output, guess again. That loop burns tokens and produces worse fixes. We just cut it short.
The data tells the story
The Stack Overflow 2025 Developer Survey found that 84% of developers use or plan to use AI tools in their development process. 51% of professional developers use them daily. But 46% say they don't trust the accuracy of the output. That's up from 31% the year before.
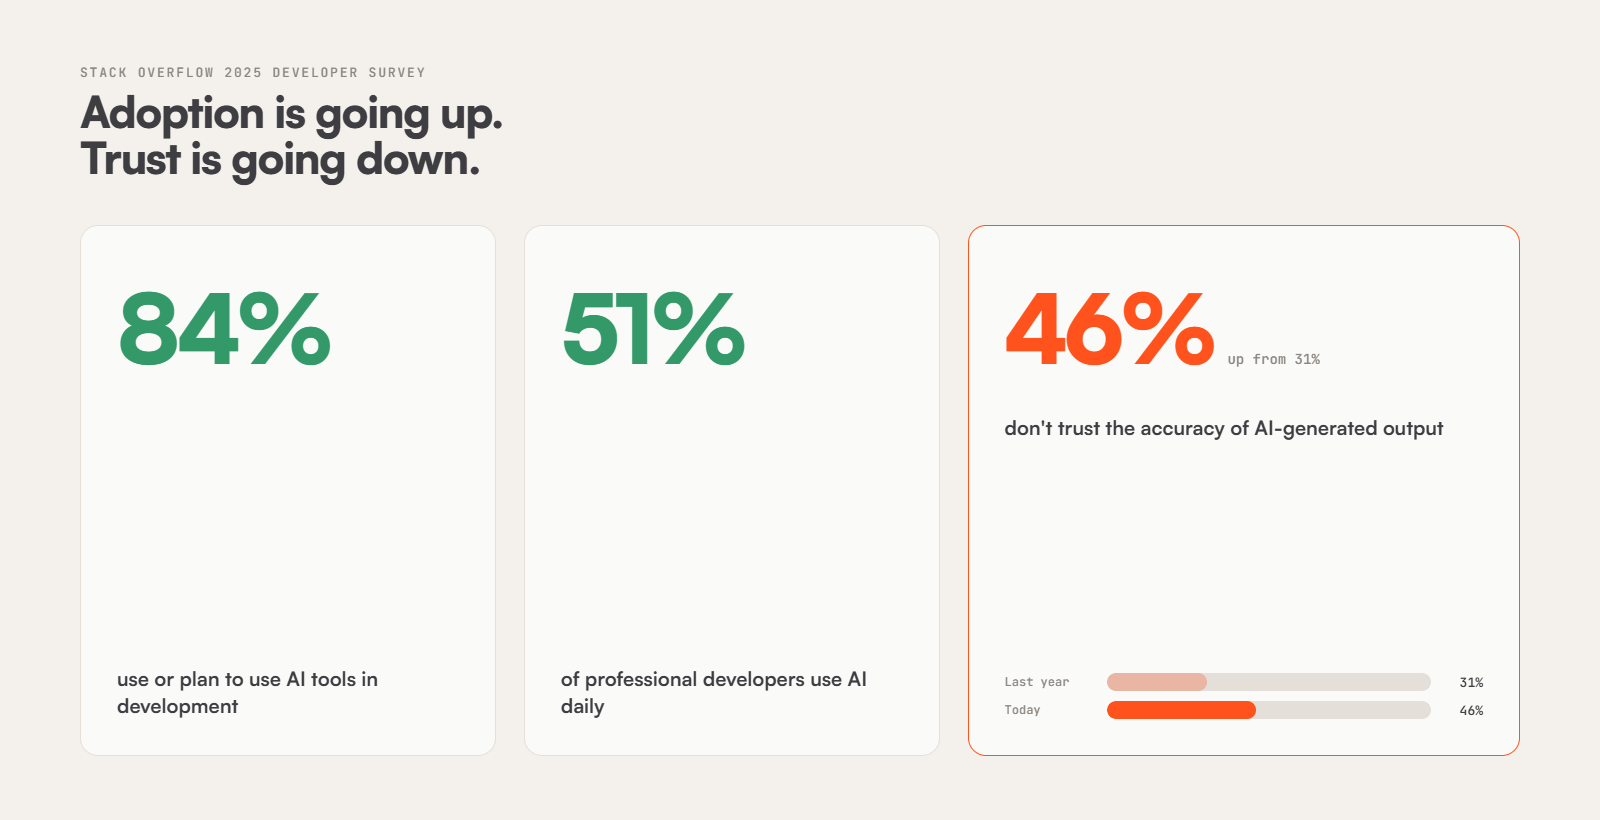
Adoption is going up. Trust is going down. That gap has a cost.
Harness's State of Software Delivery 2025 report found that 67% of developers spend more time debugging AI-generated code. AI wrote it fast. You're spending your morning figuring out why it doesn't work.
The culprit isn't the models. It's the debugging loop.
What agents do without a debugger
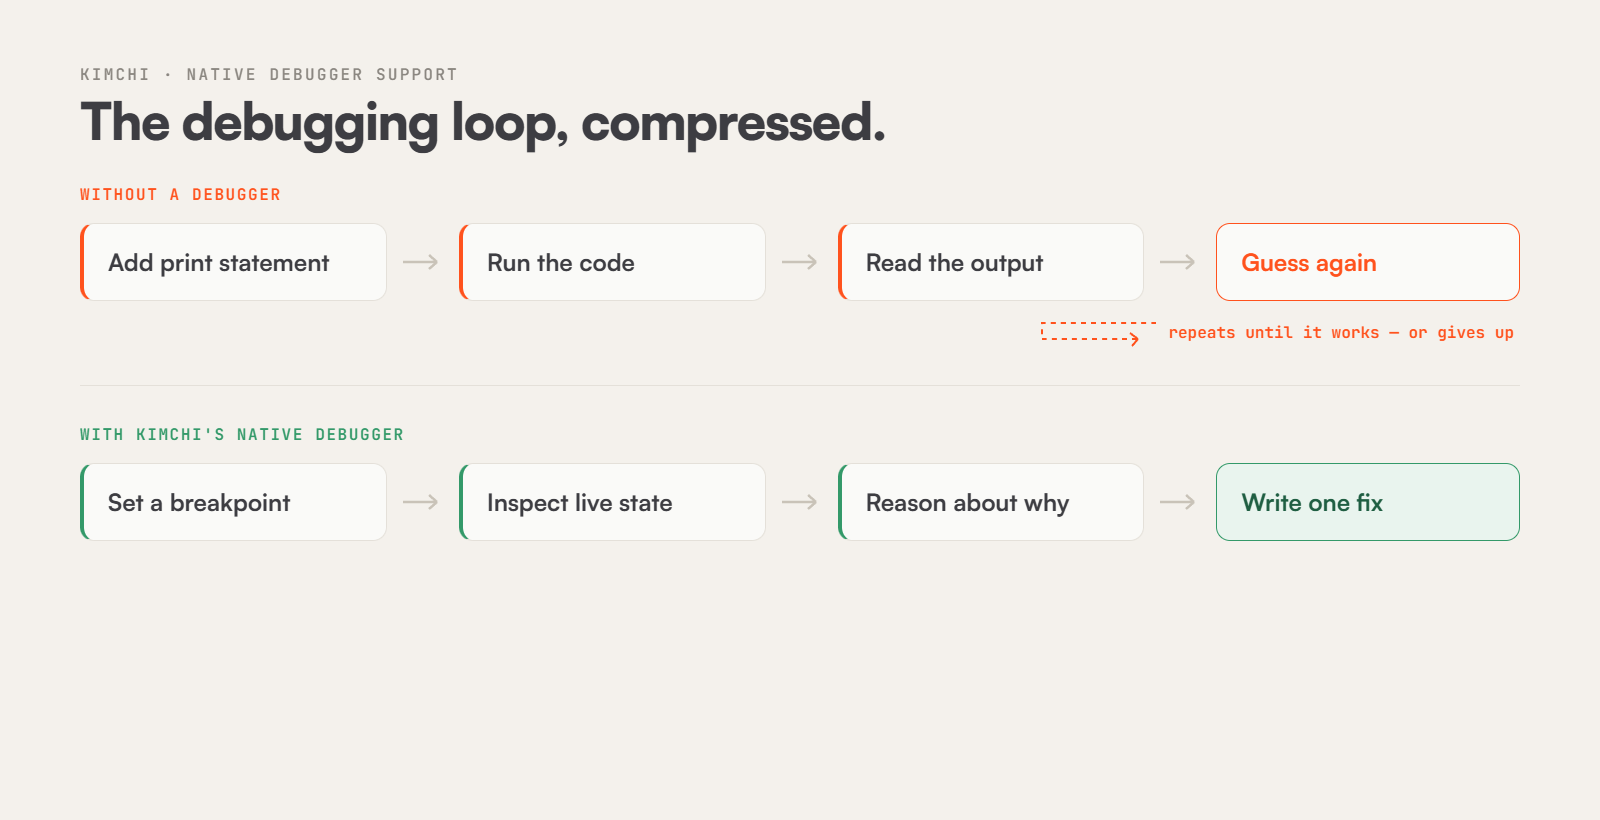
Without a real debugger, an AI coding agent falls back to the same approach a junior developer uses on their first week: add a print statement, run the code, read the output, repeat. It works for simple bugs. It doesn't scale to hard ones.
The agent can only see what it explicitly printed. Everything else - the heap, the call stack, live object graphs - is invisible. It generates more guesses, more patches, more re-runs. Token cost climbs. Quality doesn't always follow.
What Kimchi can do now
Kimchi connects to your debugger through the Debug Adapter Protocol (DAP). That's the same open standard VS Code, Neovim, and most modern editors use to talk to language-specific debuggers. One protocol, every language. Kimchi speaks it natively, which means it gets the full debugger surface, not a stripped-down wrapper.
In practice, Kimchi can now:
- Set and clear breakpoints at specific lines or on conditions, without touching your code
- Inspect live variables at any point in execution: locals, globals, object fields, the whole scope chain
- Read full stack traces and navigate up and down the call stack
- Step through execution line by line, into functions, or over them
- Evaluate expressions in the current execution context without modifying source files
The agent doesn't guess anymore. It pauses, looks, reasons about what it sees, and decides what to do next.
Kimchi has spoken LSP since launch. That gives it live access to type information, symbol definitions, references, and diagnostics. DAP is the natural complement. LSP understands your code statically. DAP understands it dynamically.
LSP tells the agent what your code means. DAP shows it what your code does. Most bugs live in the gap between those two things.
Supported languages
Native debugger support ships today for Python, Go, JavaScript/TypeScript, and C++.
- Python via debugpy (Microsoft's DAP-compliant Python debugger, the same one VS Code uses)
- Go via Delve (the de facto standard Go debugger, goroutine-aware)
- JavaScript / TypeScript / Node.js via vscode-js-debug (Microsoft's DAP-compatible JavaScript debugger, the same one VS Code uses)
- C++ via lldb-dap (LLVM's debug adapter)
More adapters are coming. If there's a debugger you're missing, let us know.
The cost advantage gets better
Research from Microsoft (the Debug2Fix paper, arXiv:2602.18571) found that coding agents with interactive debugging outperform baseline agents by 12-22% on bug-fixing benchmarks, depending on the model. GPT-5 saw the largest gain: 21.8% relative improvement. Claude Haiku 4.5 improved 15.9%. Claude Sonnet 4.5 improved 12.9%.
The loop compression is the real win. Instead of guess, patch, run, read output, guess again, the agent pauses at the exact line where state diverges from expectation, reads the live values, understands why, and writes one fix. Fewer iterations. Lower token cost. Lower review burden.
Kimchi's multi-model orchestration delivers 2.5x lower inference cost on serverless models compared to running every task on a frontier model, at the same quality bar. The routing logic assigns model capacity to match task complexity. Simple edits go to faster, cheaper models. Reasoning-heavy work escalates to more capable ones.
Native debugging makes this routing smarter. Debugging sessions on hard bugs used to require the most capable models, because the agent was working with incomplete information. With live debugger access, the agent has complete information at each step. That structured context is something cheaper models handle well. The reasoning load per step goes down. The quality of the fix goes up.
Fewer re-run cycles means fewer tokens burned. If you've set budget caps per user or per team, those caps go further when the agent isn't guessing through five iterations. The debugger isn't just a feature. It's a cost governance lever.
How Kimchi compares
As of August 2026, no major AI coding tool ships built-in DAP support. Copilot, Claude Code, and Cursor can read your code and suggest fixes. They can't attach to a live debug session natively. They work from static snapshots. Kimchi works from live runtime state.
An agent that can only read source files has to infer runtime behavior. An agent with a debugger can observe it. That's the difference between guessing and knowing.
Your code stays local
The Kimchi CLI runs locally. The debug adapter, session state, variable values, and stack frames all stay on your machine. LLM inference calls go to your configured endpoint. That's Kimchi's serverless API by default, or your own VPC if you're self-hosting. Your source code and debug session data never leave your environment in any mode.
Start using it today
Native debugger support is available now for all Kimchi users. Install your language's debug adapter, open a session, and tell Kimchi to debug. It'll take it from there.
If you run into anything, file an issue or drop into our Discord. More languages and better step-through UX are on the near-term roadmap.